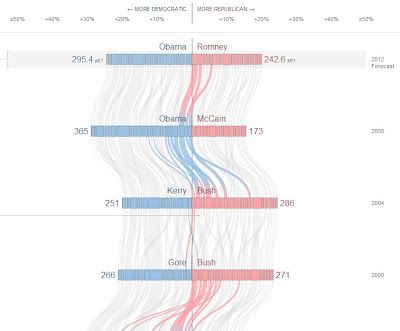
The New York Times has published an excellent interactive infographic that can help us to examine critical elections. The interactive inforgraphic illustrates how states have shifted between the Republican and Democratic parties over time. Remember, a major factor in a critical election is a change (or a major shift) in the coalitions that support each party. For example, the election of 1968 (and to a lesser extent 1964) has been argued as a critical election, and upon looking at the info-graphic we can see a major shift in the voting trend from the Democratic to the Republican parties in most states (in 1964 the noticeable shift is in the southern states, who voted Republican for the first time since the Civil War).
As for our critical election of 2008, we do see a noticeable shift to the Democratic party from almost every state, and even some states "turning blue" for the first time since the 1960's (Indiana). Is this evidence of critical election? 2012 may give us some answers...
From The New York Times:
Over the Decades, How States Have Shifted

No comments:
Post a Comment
Note: Only a member of this blog may post a comment.